Apache Druid for Real-Time Data Analysis Training Course
Apache Druid is an open-source, column-oriented, distributed data store written in Java. It was designed to quickly ingest massive quantities of event data and execute low-latency OLAP queries on that data. Druid is commonly used in business intelligence applications to analyze high volumes of real-time and historical data. It is also well suited for powering fast, interactive, analytic dashboards for end-users. Druid is used by companies such as Alibaba, Airbnb, Cisco, eBay, Netflix, Paypal, and Yahoo.
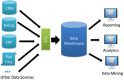
In this instructor-led, live course we explore some of the limitations of data warehouse solutions and discuss how Druid can compliment those technologies to form a flexible and scalable streaming analytics stack. We walk through many examples, offering participants the chance to implement and test Druid-based solutions in a lab environment.
Format of the Course
- Part lecture, part discussion, heavy hands-on practice, occasional tests to gauge understanding
Thank you for sending your enquiry! One of our team members will contact you shortly.
Thank you for sending your booking! One of our team members will contact you shortly.
Course Outline
Introduction
Installing and Starting Apache Druid
Druid Architecture and Design
Real-Time Ingestion of Event Data
Sharding and Indexing
Loading Data
Querying Data
Visualizing Data
Running a Distributed Cluster
Druid + Apache Hive
Druid + Apache Kafka
Druid + Others
Troubleshooting
Administrative Tasks
Summary and Conclusion
Requirements
- A basic understanding of data infrastructure.
- A general knowledge of distributed systems.
- Basic Linux command line familiarity.
Audience
- Application developers
- Software engineers
- Technical consultants
- DevOps professionals
- Architecture engineers
21 Hours
Open Training Courses require 5+ participants.
Apache Druid for Real-Time Data Analysis Training Course - Booking
Apache Druid for Real-Time Data Analysis Training Course - Enquiry
Apache Druid for Real-Time Data Analysis - Consultancy Enquiry
Consultancy Enquiry
Testimonials (5)
I liked Pablo's style, the fact that he covered a lot of subjects from report design , customization with html to implementing simple ML algortithms. Good balance theoretical information / exercices. Pablo really covered all topics i was interested in and gave comprehensive answers to my questions.
Cristian Tudose - SC Automobile Dacia SA
Course - Advanced Data Analysis with TIBCO Spotfire
how the trainor shows his knowledge in the subject he's teachign
john ernesto ii fernandez - Philippine AXA Life Insurance Corporation
Course - Data Vault: Building a Scalable Data Warehouse
Actual application of spotfire and all basic functions.
Michael Capili - STMicroelectronics, Inc.
Course - Introduction to Spotfire
Real world knowledge from someone in the industry
Matthew Cerbas - Shield Consulting Solutions, Inc.
Course - Grafana
I genuinely enjoyed the lots of labs and practices.
Vivian Feng - Destination Canada
Course - Data Analysis with SQL, Python and Spotfire
Upcoming Courses
Related Courses
Advanced Alerting and Automation with Grafana and Prometheus
14 HoursThis instructor-led, live training in Lithuania (online or onsite) is aimed at advanced-level DevOps and SRE professionals who wish to enhance their alerting and automation skills with Grafana and Prometheus.
By the end of this training, participants will be able to:
- Create and manage advanced alerting rules in Prometheus.
- Integrate Prometheus Alertmanager with external tools using webhooks.
- Automate responses to alerts for faster issue resolution.
- Use Grafana to visualize and manage alerts effectively.
Read more...
Advanced Data Analysis with TIBCO Spotfire
14 HoursThis instructor-led, live training in Lithuania (online or onsite) is aimed at business analysts who wish to learn advanced Spotfire Analyst techniques for analyzing data.
By the end of this training, participants will be able to:
- Share visualizations among different team members.
- Secure access to software based on roles and access controls.
- Create visualizations such as map charts.
- Integrate statistical computing languages such as R with Spotfire.
Read more...
Building Effective Dashboards with Grafana and Prometheus
14 HoursThis instructor-led, live training in Lithuania (online or onsite) is aimed at intermediate-level DevOps and SRE professionals who wish to create impactful dashboards and optimize their monitoring practices using Grafana and Prometheus.
By the end of this training, participants will be able to:
- Understand best practices for designing effective dashboards.
- Create and configure advanced Grafana dashboard elements.
- Leverage Grafana templating for dynamic and reusable dashboards.
- Implement alerting mechanisms to enhance operational awareness.
Read more...
Custom Metrics and Instrumentation with Prometheus and Grafana
14 HoursThis instructor-led, live training in Lithuania (online or onsite) is aimed at intermediate-level developers and DevOps engineers who wish to instrument their applications to export and monitor custom metrics effectively using Prometheus and Grafana.
By the end of this training, participants will be able to:
- Understand the importance of custom metrics for application monitoring.
- Instrument applications to export custom metrics for Prometheus.
- Create and configure dashboards in Grafana to visualize custom metrics.
- Apply best practices for integrating monitoring into the development lifecycle.
Read more...
Data Vault: Building a Scalable Data Warehouse
28 HoursIn this instructor-led, live training in Lithuania, participants will learn how to build a Data Vault.
By the end of this training, participants will be able to:
- Understand the architecture and design concepts behind Data Vault 2.0, and its interaction with Big Data, NoSQL and AI.
- Use data vaulting techniques to enable auditing, tracing, and inspection of historical data in a data warehouse.
- Develop a consistent and repeatable ETL (Extract, Transform, Load) process.
- Build and deploy highly scalable and repeatable warehouses.
Read more...
Monitoring with Grafana
14 HoursThis instructor-led, live training in Lithuania (onsite or remote) is aimed at data analysts who wish to use Grafana for monitoring and visualizing data.
By the end of this training, participants will be able to:
- Set up the necessary development environment to start creating visualizations in Grafana.
- Set up Grafana for high availability.
- Customize panels and dashboards with data.
- Configure a reverse proxy for fast loading speeds.
Read more...
Advanced Grafana
14 HoursThis instructor-led, live training in Lithuania (online or onsite) is aimed at intermediate-level data analysts who wish to learn and utilize the advanced features and components of Grafana for data visualization and analysis.
By the end of this training, participants will be able to:
- Gain an in-depth understanding of advanced Grafana concepts and components.
- Leverage template variables and dynamic dashboards for enhanced data visualization.
- Use Grafana Query Language for complex queries.
- Learn best practices for scaling Grafana, optimizing performance, and ensuring high availability.
Read more...
Grafana Comprehensive
21 HoursThis instructor-led, live training in Lithuania (online or onsite) is aimed at intermediate-level system administrators and monitoring professionals who wish to effectively use Grafana for setting up monitoring solutions, managing dashboards, and creating alerts.
By the end of this training, participants will be able to:
- Understand the difference between observability and monitoring.
- Install and set up the Grafana server.
- Configure and connect various data sources such as Prometheus, InfluxDB, and ElasticSearch.
- Create, manage, and customize dashboards and charts.
- Use variables and queries to create dynamic dashboards.
- Set up notifications and alerts through Grafana.
- Install and manage plugins to extend Grafana’s functionality.
Read more...
Grafana and GLPI Administration
21 HoursThis instructor-led, live training in Lithuania (online or onsite) is aimed at beginner to intermediate-level IT professionals who wish to gain the knowledge and practical skills necessary to excel in the administration of Grafana and GLPI.
By the end of this training, participants will be able to:
- Create and customize Grafana dashboards with different visualizations.
- Implement alerting and notifications for monitoring.
- Administer user accounts, teams, and permissions.
- Manage IT assets effectively, including hardware and software inventory.
- Implement a helpdesk system for user support and ticket management.
Read more...
Grafana and Graphite
14 HoursThis instructor-led, live training in Lithuania (online or onsite) is aimed at web developers and DevOps engineers who wish to visualize and monitor data with Grafana and Graphite.
By the end of this training, participants will be able to:
- Aggregate and visualize metrics about systems and applications.
- Create a StatsD client for gathering application metrics.
- Build informative and dynamic dashboards with Grafana.
- Gather insights from back-end performance.
Read more...
Introduction to Spotfire
14 HoursThis instructor-led, live training in Lithuania (online or onsite) is aimed at business analysts and data analysts who wish to learn basic Spotfire Analyst techniques for analyzing data.
By the end of this training, participants will be able to:
- Install and configure TIBCO Spotfire.
- Combine data from different databases.
- Visualize large datasets.
- Create and share complex dashboards.
Read more...
AI-Driven Data Analysis with TIBCO Spotfire X
14 HoursThis instructor-led, live training in Lithuania (online or onsite) is aimed at business analysts and data analysts who wish to use TIBCO Spotfire X with its artificial intelligence capabilities to visualize, transform, and analyze data.
By the end of this training, participants will be able to:
- Install and configure TIBCO Spotfire X.
- Understand the features and architecture of TIBCO Spotfire X.
- Understand the concepts behind augmented and predictive analytics.
- Learn how to load, process, and visualize data using Spotfire X.
- Create interactive and enhanced data visualizations.
Read more...
Data Analysis with SQL, Python and Spotfire
14 HoursIn this instructor-led, live training in Lithuania, participants will learn three different approaches for accessing, analyzing and visualizing data. We start with an introduction to RDMS databases; the focus will be on accessing and querying an Oracle database using the SQL language. Then we look at strategies for accessing an RDMS database programmatically using the Python language. Finally, we look at how to visualize and present data graphically using TIBCO Spotfire.
Format of the Course
Interactive lecture and discussion.
Lots of exercises and practice.
Hands-on implementation in a live-lab environment.
Read more...
TIBCO for Developers
21 HoursThis instructor-led, live training in Lithuania (online or onsite) is aimed at developers who wish to use BusinessEvents and ActiveMatrix Service Bus to develop, deploy, and manage event driven applications.
By the end of this training, participants will be able to:
- Set up the necessary development environment to start developing.
- Build distributed, stateful, rule-based event-processing systems.
- Manage business events data and execute proper business rules.
- Reduce the event response time in large-scale, data driven applications.
- Build applications for fraud detection, track-and-trace, real-time customer offer generation, etc.
Read more...
TIBCO Statistica
14 HoursThis instructor-led, live training in Lithuania (online or onsite) is aimed at engineers, researchers, and data analysts who wish to use TIBCO Statistica features to create analytic workflows and models.
By the end of this training, participants will be able to:
- Install and navigate the TIBCO Statistica program to build and manage data analysis projects.
- Understand statistics basics to analyze data and generate useful insights for the business.
- Explore advanced topics to work with big data and machine learning using TIBCO Statistica.
Read more...